
Blog
Hydraulic modelling and field calibration
Testing "what happens to end-of-line pressure if I throttle this valve?" in the field is expensive. A hydraulic model builds the network's pipes, elevations and demand in software and answers those questions in advance.
What a model is and what it is for
A hydraulic model is a computer simulation of a drinking-water distribution network. The network is a graph: pipes are edges, junctions and draw-off points nodes. Each pipe carries a length, diameter, material and roughness; each node an elevation and an assigned demand. With boundary conditions added — reservoir levels, pump curves — the software solves for the pressure at every node and the flow in every pipe.
A steady-state solution solves the network for one instant of fixed demand. An extended-period simulation solves it hour by hour across a daily demand pattern, showing reservoirs filling and emptying, pump run times and the day–night pressure swing.
The model answers questions that are expensive or risky to try in the field: designing pressure management, the effect of a new main or reservoir, re-routing a zone's supply, and how loss reduction changes network behaviour. It is a decision-support tool, not a substitute for the network itself.
Input data
A model is only as good as its input data. The network geometry usually comes from the utility's map and geographic information system: pipe route, diameter, material, year laid and valve positions. Because that data must be current and complete, a modelling exercise often runs alongside a network mapping and GIS effort.
Node elevations come from a digital elevation model or a levelling survey; since pressure depends on elevation difference, elevation errors shift modelled pressure systematically. Roughness is first estimated from pipe material and age, then corrected in calibration.
Boundary conditions are also defined: reservoir and pumping-station levels, pump flow–head curves, pressure-reducing valve settings and the total production flow — ideally backed by measurement records from the day the model represents.
Demand allocation
The total inflow must be shared out among the model's nodes, since consumption is really drawn from thousands of service connections while the model has far fewer. The common method assigns demand to each node in proportion to the subscribers near it, or to its share of billed consumption, so the nodal demands sum to the measured inflow.
A steady-state run uses a single demand level, usually the daily average or peak hour. An extended-period run applies a daily pattern of hourly multipliers — low at night, high morning and evening — with separate patterns for customer types such as industrial or public.
Physical loss is itself a kind of demand, and it rises with pressure. Coarse models enter it as a fixed extra draw across all nodes; detailed models use a pressure-dependent leakage term. Flow measurement and DMA minimum night flow size this component.
Field calibration
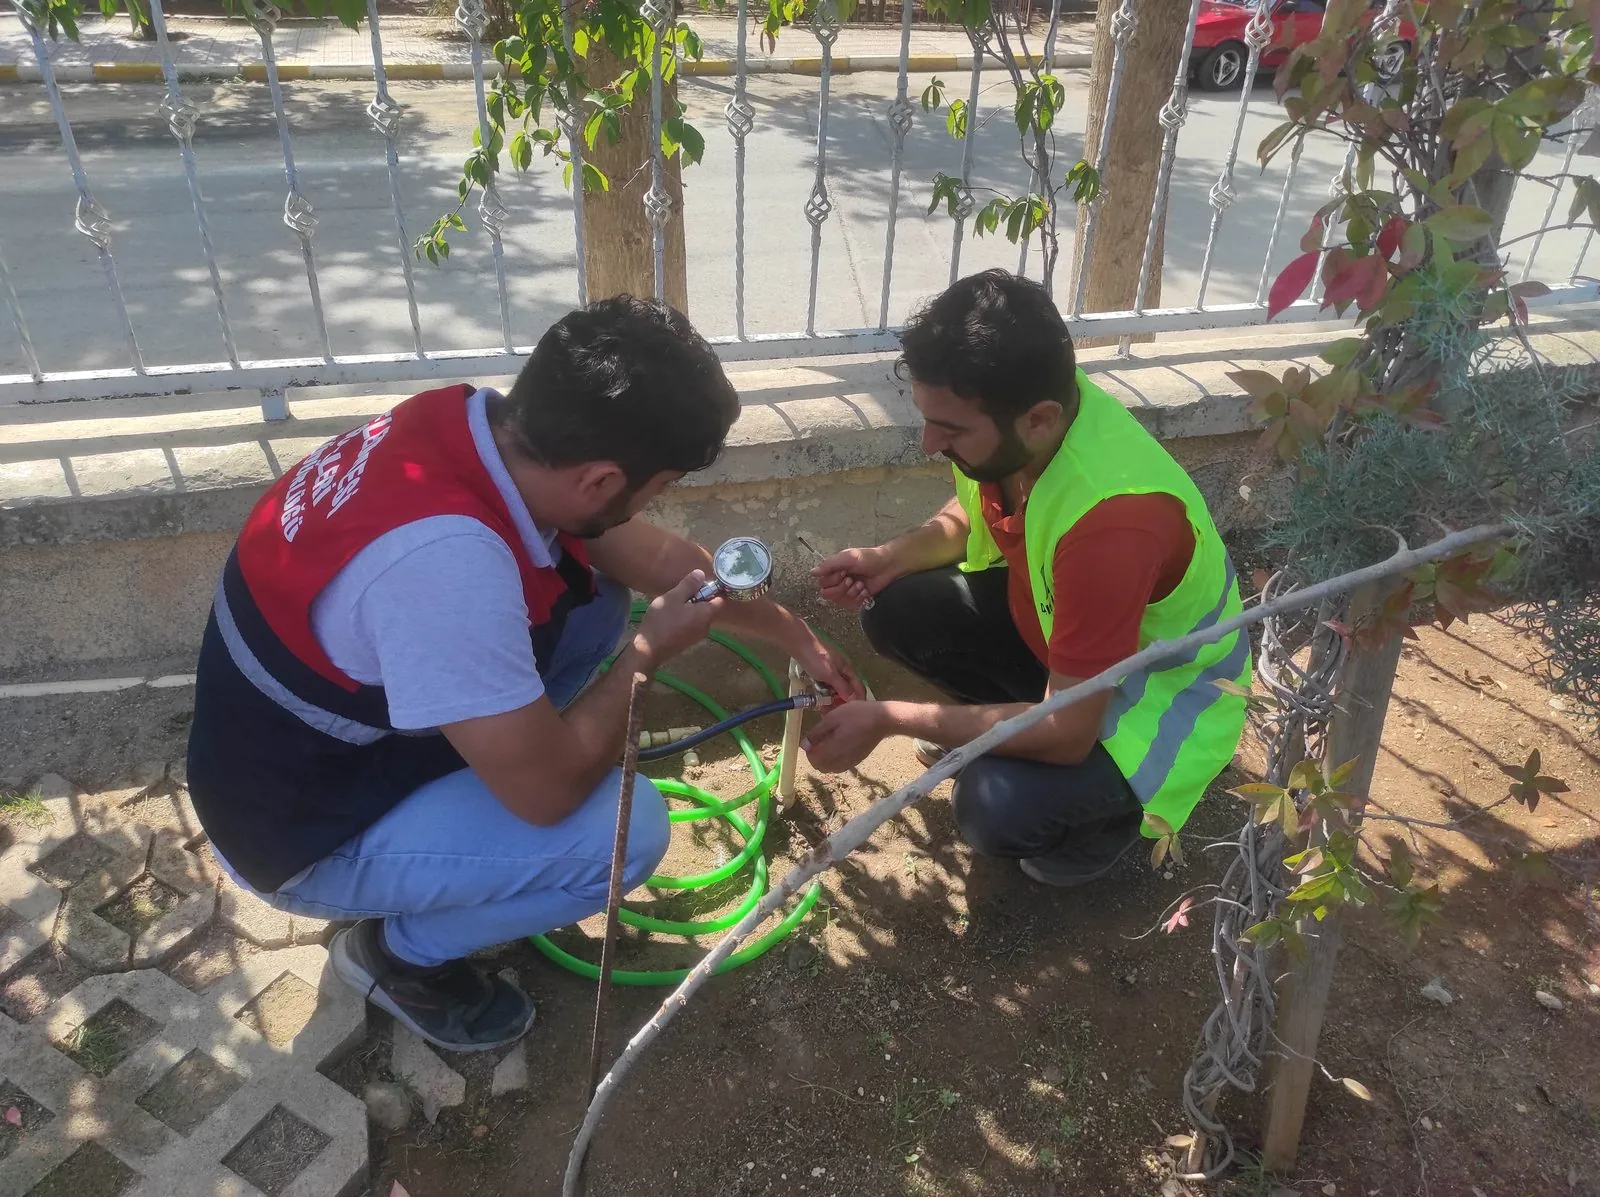
A newly built model does not reflect reality exactly; roughness estimates, demand allocation and map errors move the output off the truth. Calibration brings it back toward field measurements: pressure loggers at several points and flow meters on selected mains log for at least a full day, preferably a weekday.
The model is run for that same day and its pressures and flows are compared with the measurements. Obvious errors are corrected first — an open valve thought closed, a wrong diameter, a bad elevation — then roughness and demand allocation are adjusted until model and measurement agree at all points at once. Forcing one point at the cost of the others is not calibration.
A calibrated model is reliable for the conditions under which it was measured; as demand level or pump configuration move away from that range, uncertainty grows.
Scenarios
A calibrated model lets “what if?” questions be tried cheaply. One scenario changes a pressure-reducing valve target: how far the setting can be lowered before end-of-line points fall below the acceptable limit. Another changes zone boundaries: the effect on neighbouring zones' pressure and flow of opening or closing a DMA boundary valve.
A fire-flow scenario checks the residual pressure in the network while a high flow is drawn from a hydrant. A loss-reduction scenario examines how cutting physical loss by a given fraction feeds through to the minimum night flow and the average pressure. Each comes from changing one input of the calibrated model and solving again; results are read as a change from the present state, not as absolute numbers, since a comparative result is more trustworthy than a single hard figure.
The model's limits
A model is only as good as its input data — garbage in, garbage out. Stale or incomplete GIS records, unrecorded connections, wrong diameter or material, and unknown closed valves all pull the solution quietly the wrong way. Such errors often end up buried in the roughness adjustment during calibration, so the model can look as if it “fits” while being physically wrong.
Accuracy should not be overstated. A well-calibrated model gives pressures to within a few metres of head and flows to within a few to a few tens of per cent; it is not a precise instrument. As the network changes — new mains, customers, renewed pipe, altered pumping — the model ages and needs periodic re-calibration.
Even so, a model compares many options that could never be tried one by one in the field, quickly and cheaply. A modelling exercise can be planned over a remote or video call; once the network data and measurement records are shared, the build, calibration and scenario work proceed together.
Also on the blog
Related articles.
How to tell if there is a water leak: 8 signs in a network
Signs of a hidden leak in a drinking-water network: rising night flow, pressure drop, a wi…
What is flow measurement, and how is it done in a network?
The purpose of network flow measurement, temporary measurement with a portable ultrasonic/…
Pressure management and pressure zones (PMA)
How high and fluctuating pressure drives leaks and bursts, setting up a pressure managed a…
For your network
Let's measure the loss and pinpoint it.
In a short video call we can review the current situation and the method to apply.