
Blog
Network mapping and transfer to GIS
You can only manage a network if you have a current map of it. Network mapping moves the field's pipes, valves and connections — with their locations and properties — into a digital system.
From field survey to data
Network mapping is the work of moving the physical components of a distribution network — mains, valves, hydrants, connections — into a digital form together with their positions and properties. The scope is municipal and organised-industrial-zone distribution networks; what is mapped is the street and arterial mains.
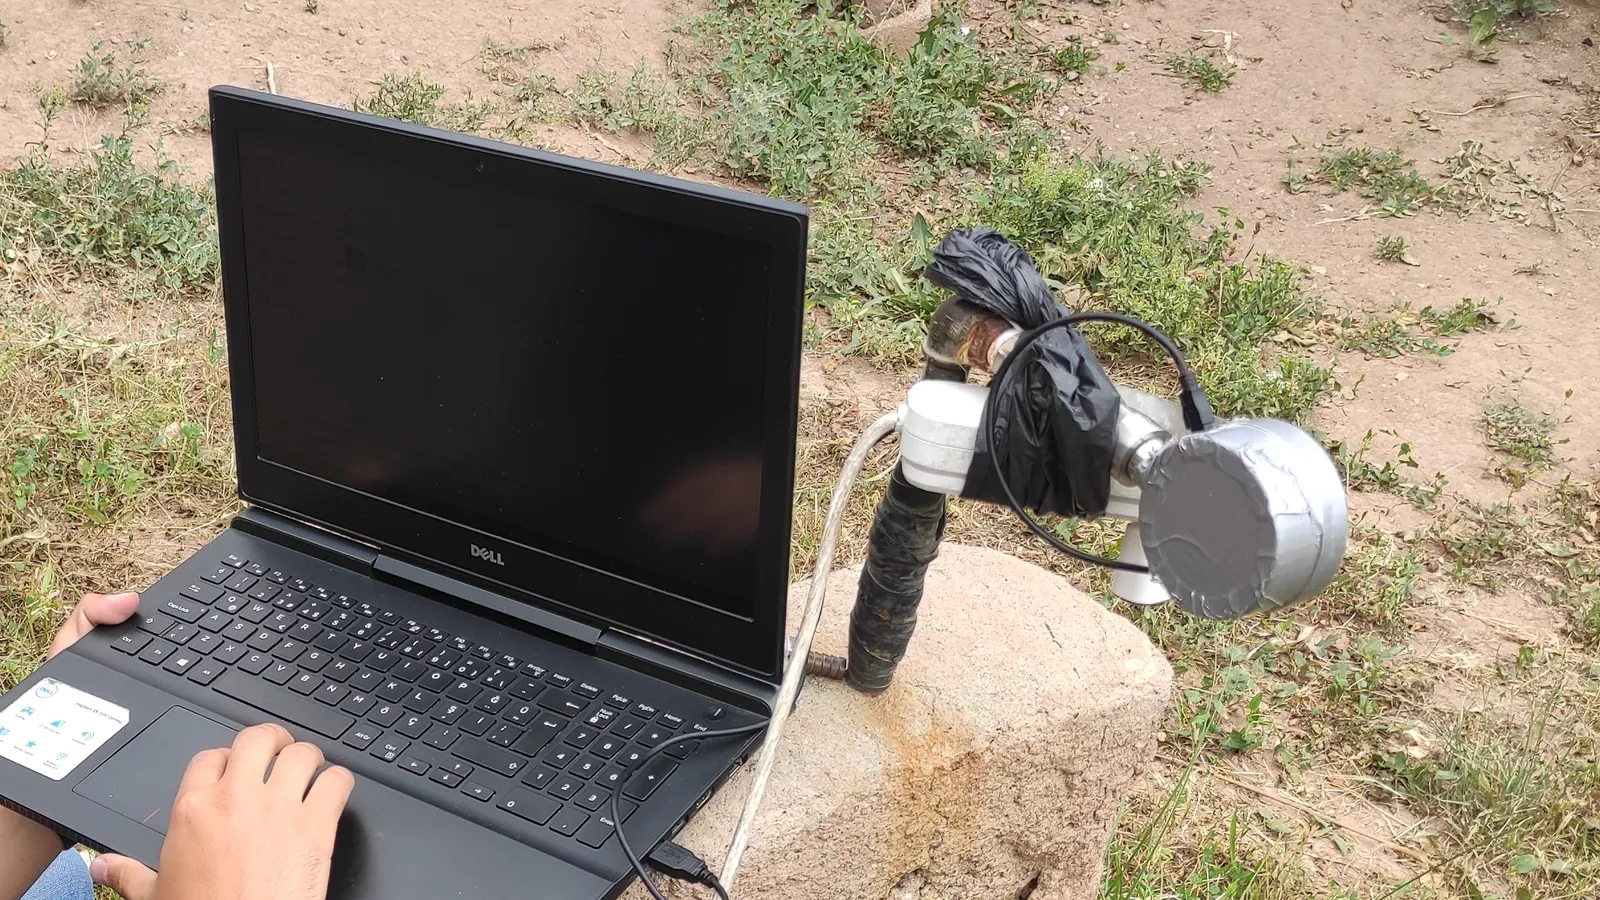
The first input comes from the field. The route and depth of a main are found from the surface without digging (see pipe locating). The positions of valves, hydrants and connections are each measured with a GPS/GNSS receiver. Every measurement is stored as a latitude–longitude pair with a label that says what the point is.
This raw data falls into two geometry types: point objects (valve, hydrant, connection, fitting) and line objects (pipe segments running between two points). The string of coordinates collected while walking the route becomes the line geometry of the main.
Attributes
Position alone is not enough. For the map to be useful, every object has to be recorded with its attributes — the fields that describe it.
Typical attributes for a pipe segment are: diameter, material (ductile iron, steel, PE, PVC, asbestos cement), year laid, the pressure zone it belongs to, and any lining information. For a valve: type (gate, butterfly, air, washout), open or closed state, diameter and turning direction. For hydrants, type and outlet size; for connections, the customer type (bulk user, industrial site) and the connection diameter.
Attributes are captured while the survey is still in the field; a field left blank becomes a gap that is hard to fill later. Fields such as year laid and material are often compiled from old paper plans and utility records, then cross-checked against what is seen on site.
The GIS layer and topology
The points and lines are loaded into a geographic information system (GIS) as a layer. The key idea here is topology: objects being connected to one another not only visually but logically.
In a topologically correct layer, pipe segments meet end to end at node points, valves sit on the main they belong to, and the system knows which valve feeds or isolates which main. Which valves must be closed to isolate a section can be computed from this connection structure. Dangling line ends, gaps, or a valve snapped to the wrong node break these queries.
Mapping therefore does not end with collecting coordinates; cleaning the geometry, splitting segments at the right places and checking the connections are an inseparable part of the job.
Accuracy class
The accuracy of a network map is not a single number; it comes from the combination of several sources and varies from object to object.
The precision of the GPS/GNSS measurement itself ranges from a few metres to a few centimetres depending on the receiver and the correction service used. Geometry obtained by digitising old paper plans is usually of lower accuracy; it depends on the plan's scale, drafting error and how well it is referenced. Field verification — seeing a valve chamber, a hydrant or a trial pit in place — ties the two sources together and catches gross errors.
In practice each object is given an accuracy or source tag: “measured by GNSS”, “digitised from a plan”, “verified on site”. Accuracy should not be overstated; a digitised main should still be confirmed from the surface and with a trial pit before any excavation.
Loading into the platform
The cleaned GIS layer is transferred into the LeakExpert platform (see platform). Pipe and valve geometry, leak points, flow and pressure measurements and field projects then appear together on one map.
This combination speeds the work up: an acoustic survey result lands on the real main on the map, a DMA boundary is drawn with its valves, a repair record is linked to the pipe segment it belongs to. Measurement and observation data now build up on a queryable layer rather than on a paper sketch.
The platform also gives the teams a single current source; the field crew, the office and the analysis all look at the same version of the map.
Keeping the map current
A network map begins to age the moment it is produced. Unless every new connection, every repair, every main renewal and every valve change is posted back to the map, the layer soon falls behind reality.
The cost of an out-of-date GIS is not just a wrong drawing. A missing main or a wrong diameter corrupts the pipe length and topology input of a hydraulic model; an unknown closed valve pulls model and field apart. In the same way the water balance and loss analysis give unreliable results if the zone boundaries and customer connections are wrong.
Updating is therefore defined as a workflow: every change made in the field is recorded with its attributes and added to the map. A mapping and updating routine can be planned over a remote or video call; once the existing sketches, plans and records are shared, the data model and the workflow are set together.
Also on the blog
Related articles.
How to tell if there is a water leak: 8 signs in a network
Signs of a hidden leak in a drinking-water network: rising night flow, pressure drop, a wi…
What is flow measurement, and how is it done in a network?
The purpose of network flow measurement, temporary measurement with a portable ultrasonic/…
Pressure management and pressure zones (PMA)
How high and fluctuating pressure drives leaks and bursts, setting up a pressure managed a…
For your network
Let's measure the loss and pinpoint it.
In a short video call we can review the current situation and the method to apply.